Featured Articles


Recent Articles
Categories
Cloud and Application Security
Counter Adversary Operations
Endpoint Security & XDR
-
CrowdStrike Named the Only Customers’ Choice in 2024 Gartner® “Voice of the Customer” for External Attack Surface Management
April 30, 2024
-
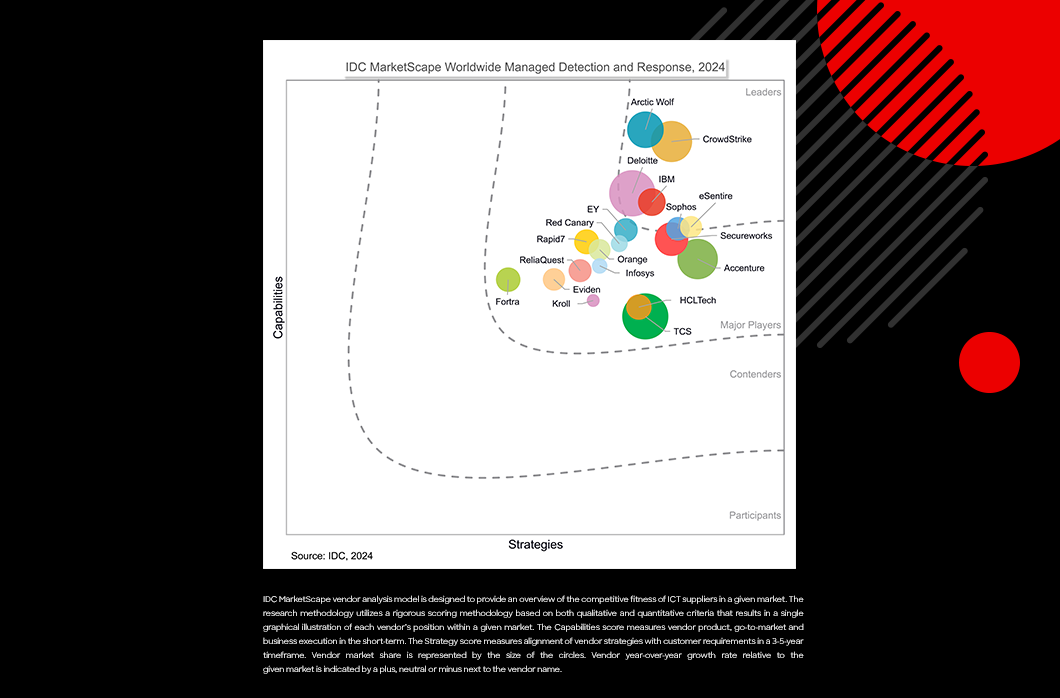
CrowdStrike Named a Leader in IDC MarketScape for Worldwide MDR
April 29, 2024
-
Falcon Fund in Focus: Nagomi Helps Customers Maximize Their Cybersecurity Investments
April 24, 2024
Engineering & Tech
-
CrowdStrike Falcon Next-Gen SIEM Unveils Advanced Detection of Ransomware Targeting VMware ESXi Environments
April 15, 2024
-
CrowdStrike’s Advanced Memory Scanning Stops Threat Actor Using BRc4 at Telecommunications Customer
September 27, 2023
-
The Windows Restart Manager: How It Works and How It Can Be Hijacked, Part 2
September 1, 2023
Executive Viewpoint
From The Front Lines
-
How to Defend Employees and Data as Social Engineering Evolves
March 22, 2024
-
The Anatomy of an ALPHA SPIDER Ransomware Attack
February 29, 2024
-
CrowdStrike Services Offers Incident Response Executive Preparation Checklist
October 23, 2023
Identity Protection
Next-Gen SIEM & Log Management
-
Building the Modern SOC: How CrowdStrike Deployed Next-Gen SIEM to Increase Search Speed by 150x and Find Issues in Seconds
March 27, 2024
-
Montage Health Consolidates Its Cybersecurity Strategy with CrowdStrike
March 4, 2024
-
4 Major Falcon LogScale Next-Gen SIEM Updates That Accelerate Time-to-Insights
January 18, 2024
Public Sector
Tech Center
Resource Center
Dive into topics ranging from endpoint security and threat intelligence, to incident response and forensic services.

See CrowdStrike Falcon® in Action
Only CrowdStrike addresses today’s most advanced threats with a true SaaS endpoint protection solution – giving you the ability to detect, prevent, monitor, and search attacks as they occur.
See Demo